#grafana-monitoring
Read more stories on Hashnode
Articles with this tag
Prometheus, the stalwart of modern monitoring solutions, offers unparalleled insights into service performance and alerts through its robust...
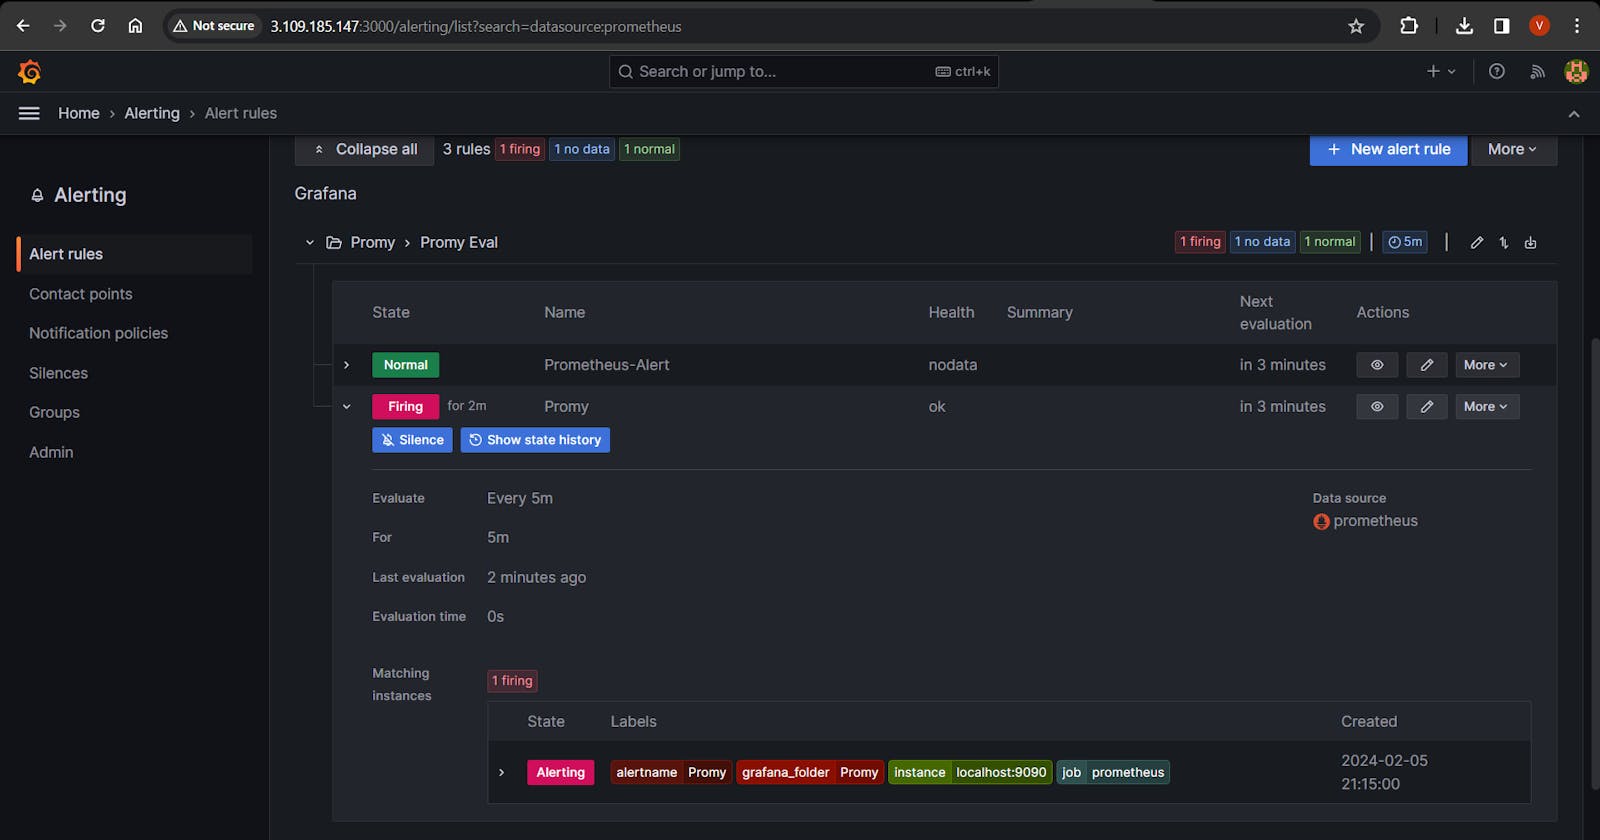
In the fast-paced world of system monitoring and management, being alerted to problems as soon as they occur is paramount. Grafana Alerting offers a...
In today's tutorial, we'll delve into creating powerful dashboards that offer insightful visualizations of your data. Dashboards provide an...
Introduction: Monitoring containerized environments is essential for ensuring the reliability, performance, and scalability of modern applications. In...
Now that we've grasped the fundamentals of Grafana, let's dive into some hands-on experience by setting it up in your local environment on AWS EC2. In...