

In the realm of DevOps, effective monitoring is paramount for ensuring the reliability and performance of systems. Grafana Cloud emerges as a powerful ally in this endeavor, offering comprehensive monitoring and alerting solutions. In this article, we will embark on a journey to unlock the full potential of Grafana Cloud for monitoring EC2 instances and managing AWS billing alerts.
Introduction
Grafana Cloud represents a robust platform for monitoring and observability, catering to the diverse needs of DevOps professionals. Building upon our previous discussions on Grafana Cloud Alerting, this guide will delve deeper into the realm of monitoring, providing step-by-step instructions for setting up monitoring with Grafana Cloud and configuring alerts for AWS billing.
Prerequisites
Before we dive into the implementation details, let's ensure we have the necessary prerequisites in place:
An active AWS account with an EC2 instance provisioned.
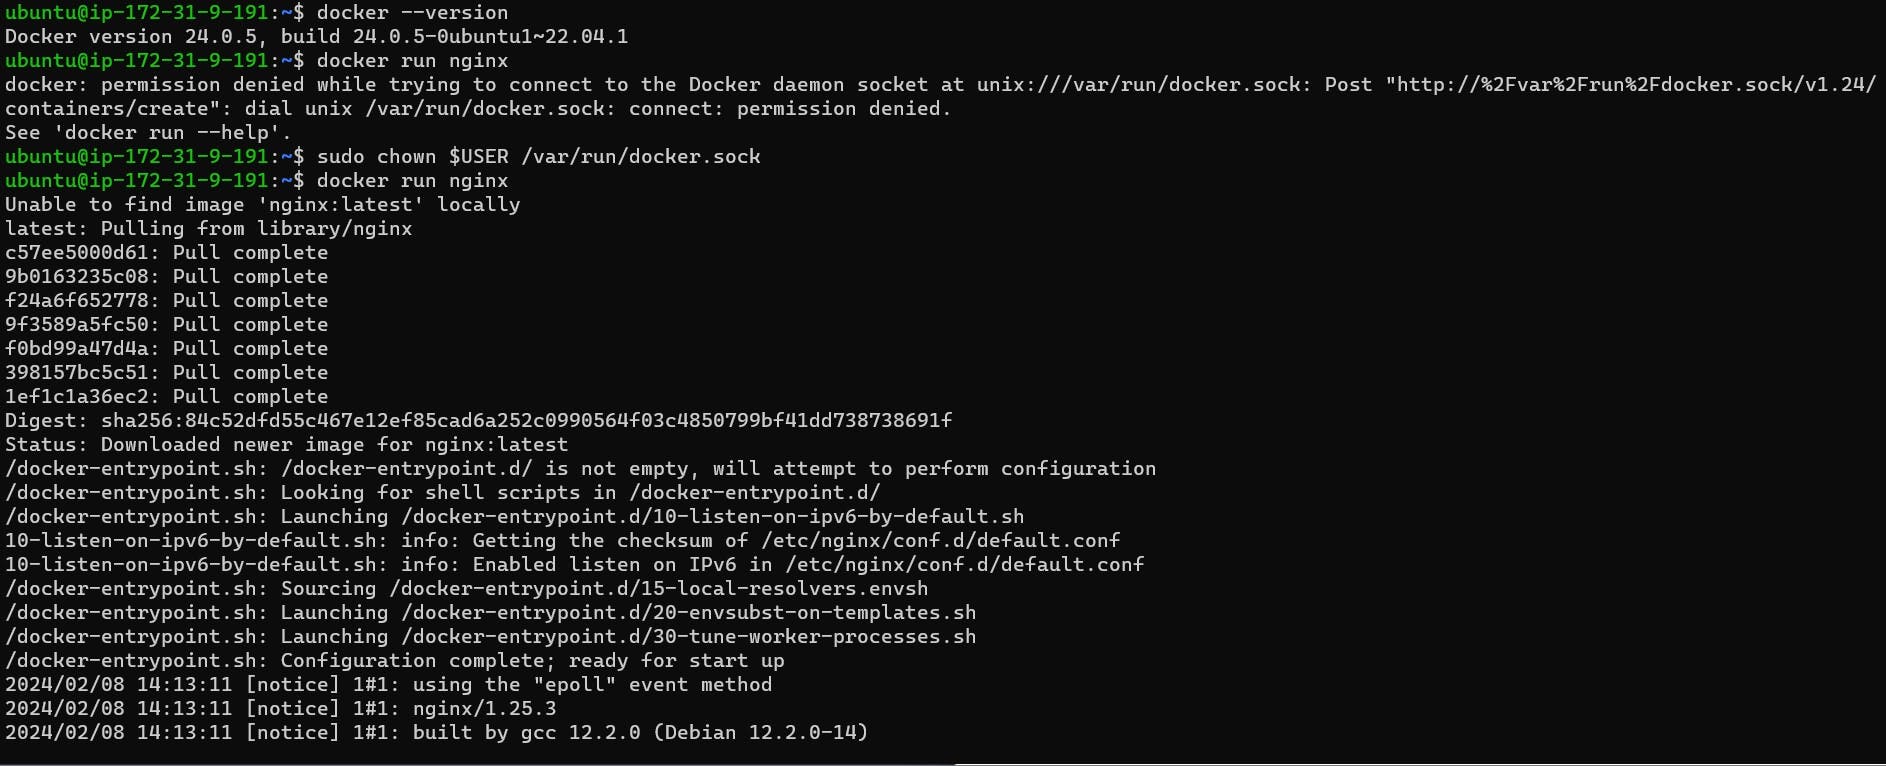
Docker installed on the EC2 instance for running monitoring containers.
Access to Grafana Cloud with a valid account.
Setting up Grafana Monitoring for Your EC2 Instance
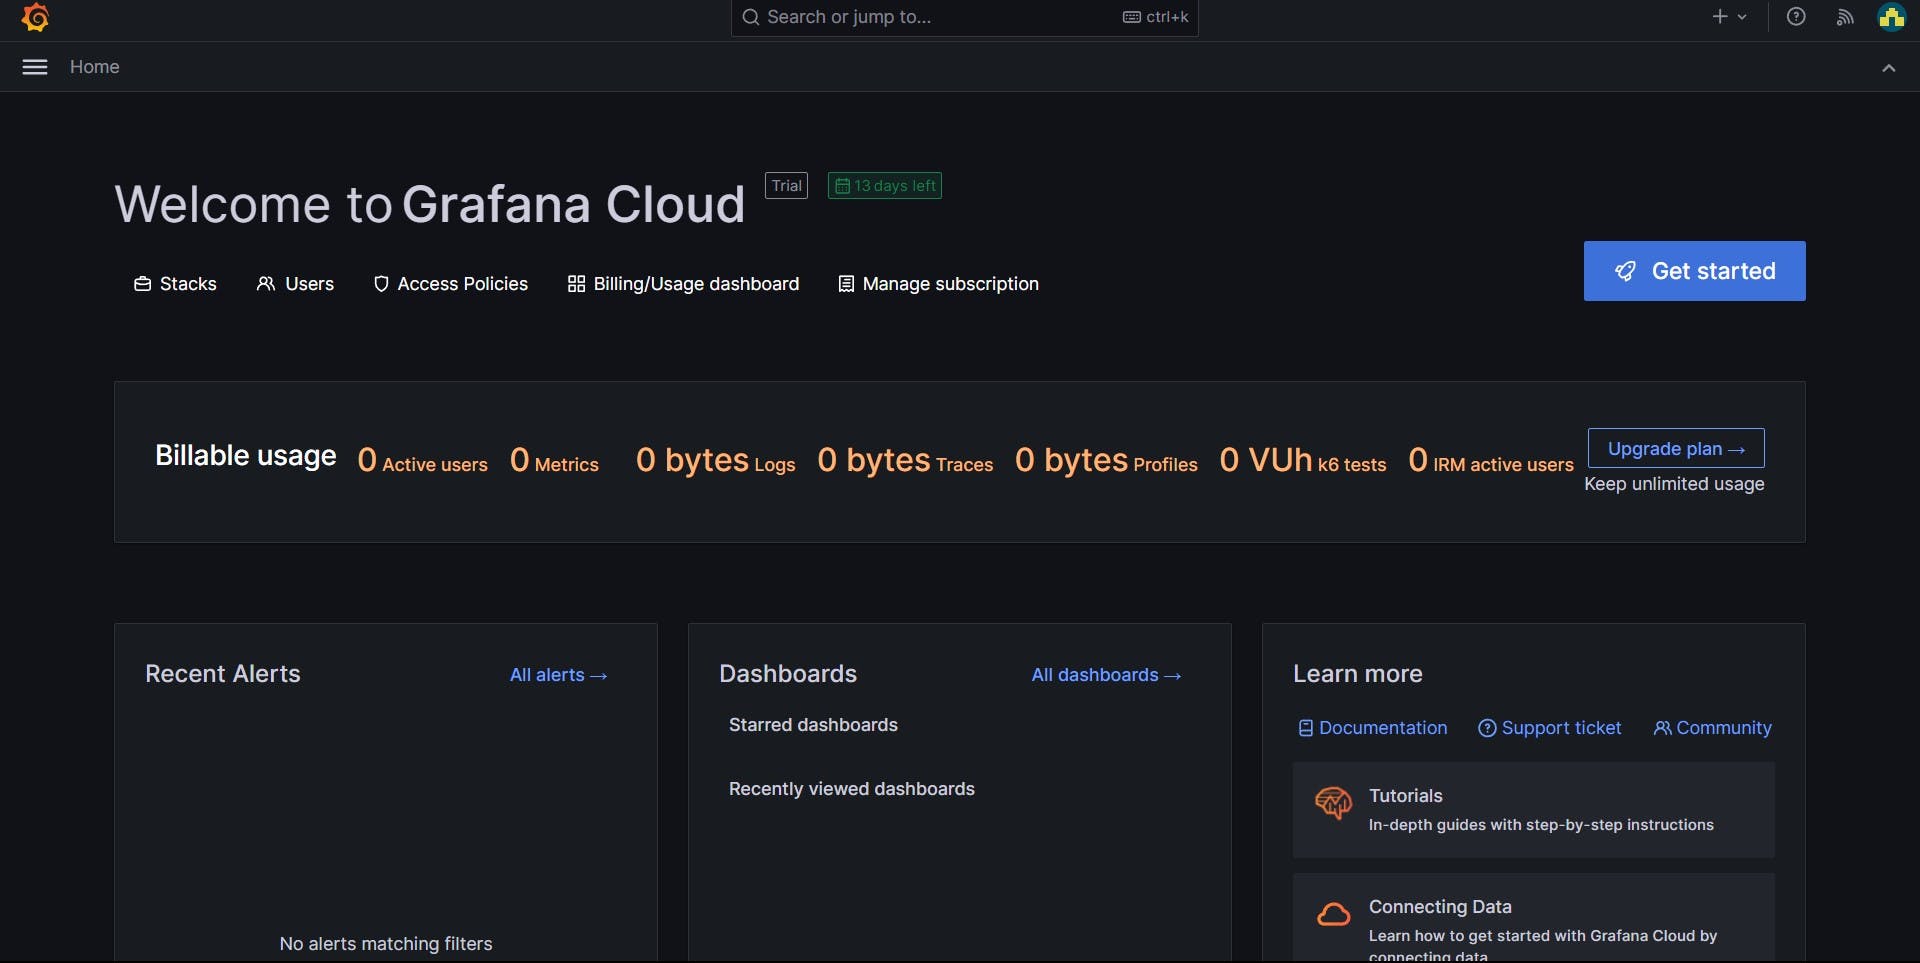
Create a Grafana Cloud Account: Begin by navigating to Grafana.com and creating a free account to access Grafana Cloud.
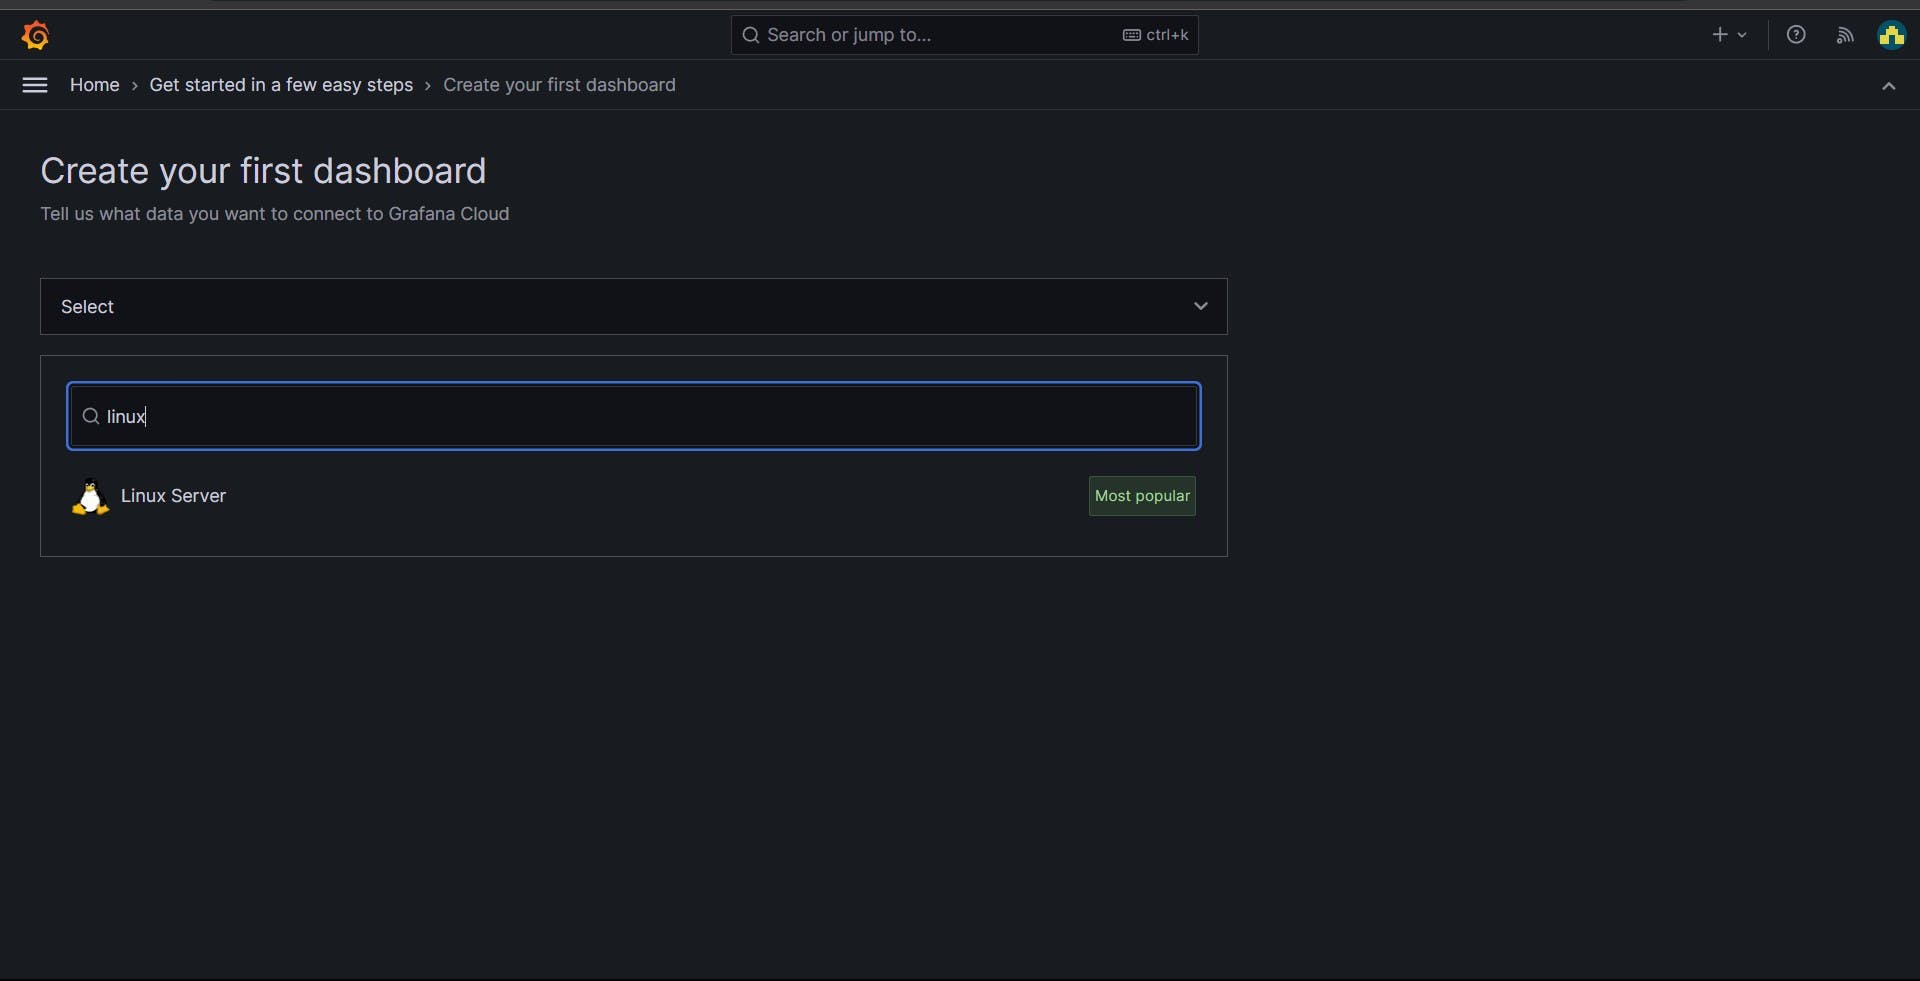
Install Linux Server Connection: Within the Grafana Cloud dashboard, install the Linux Server connection to establish communication between your EC2 instance and Grafana Cloud.
Configure Connection Settings: Set up the connection settings and deploy the Grafana agent on your EC2 instance to facilitate data collection.
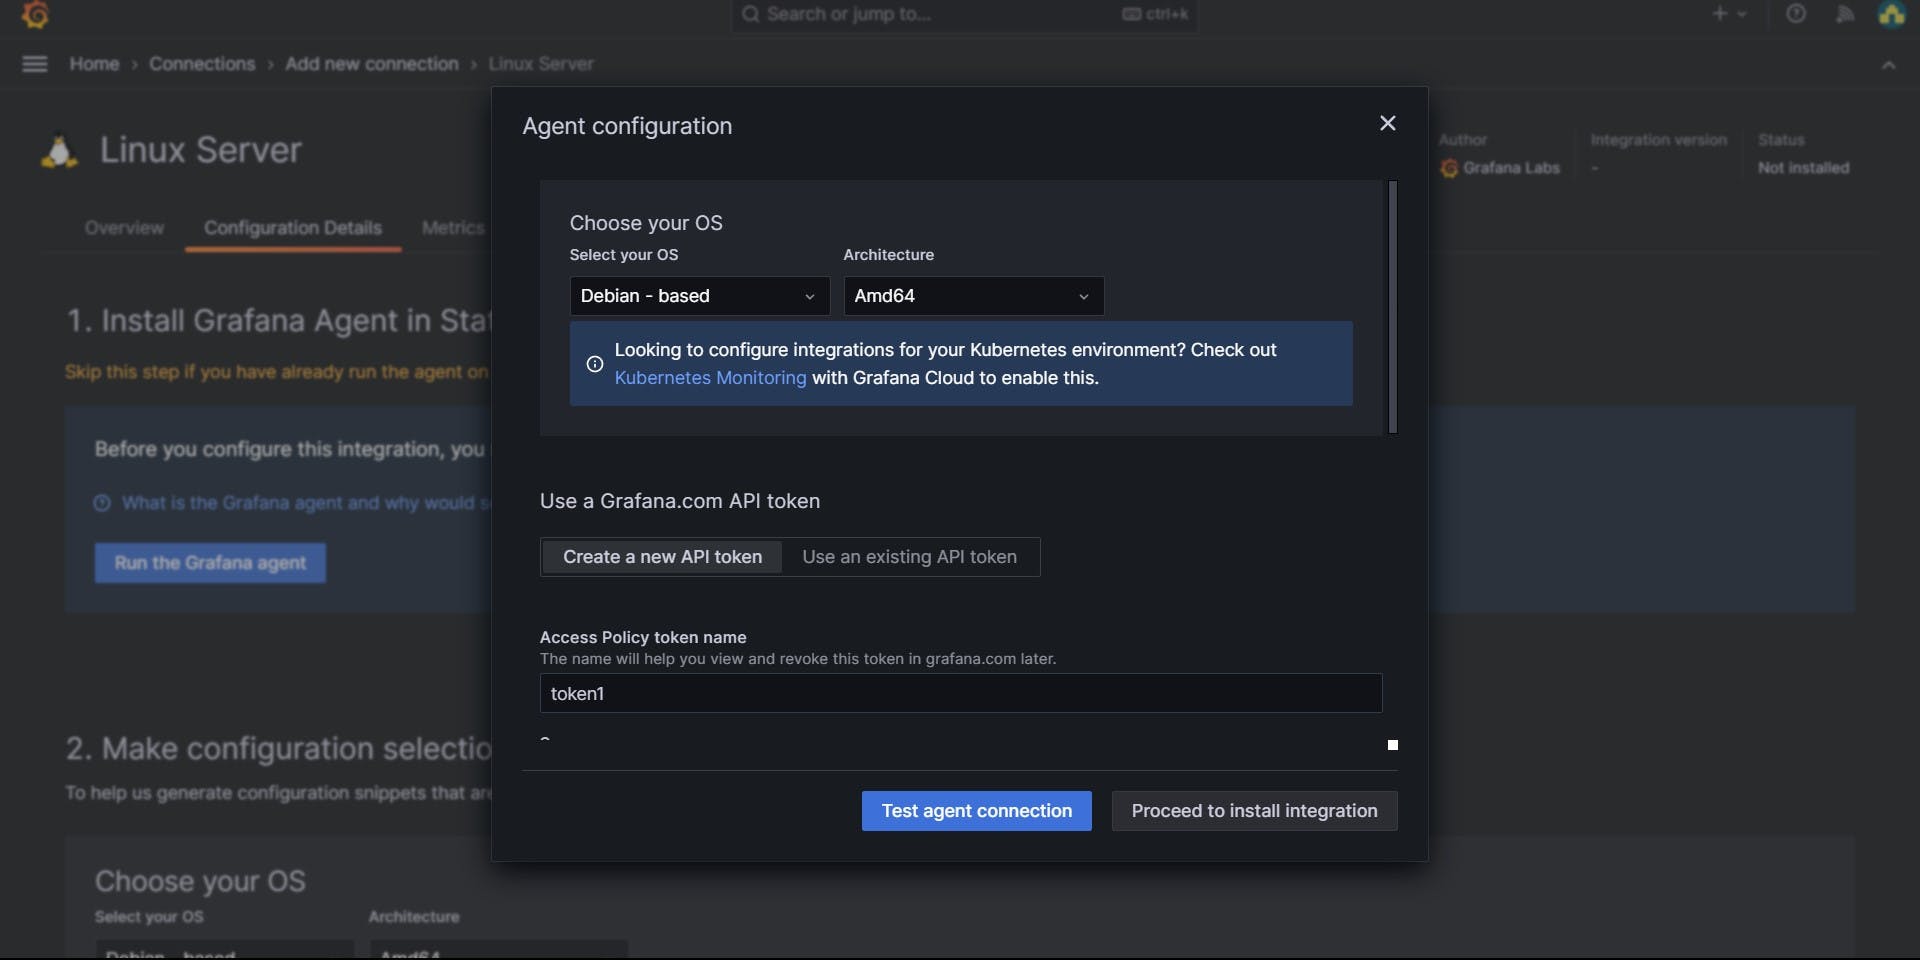
Generate API Token: Create an API token within Grafana Cloud and execute it on your EC2 instance to enable seamless integration.
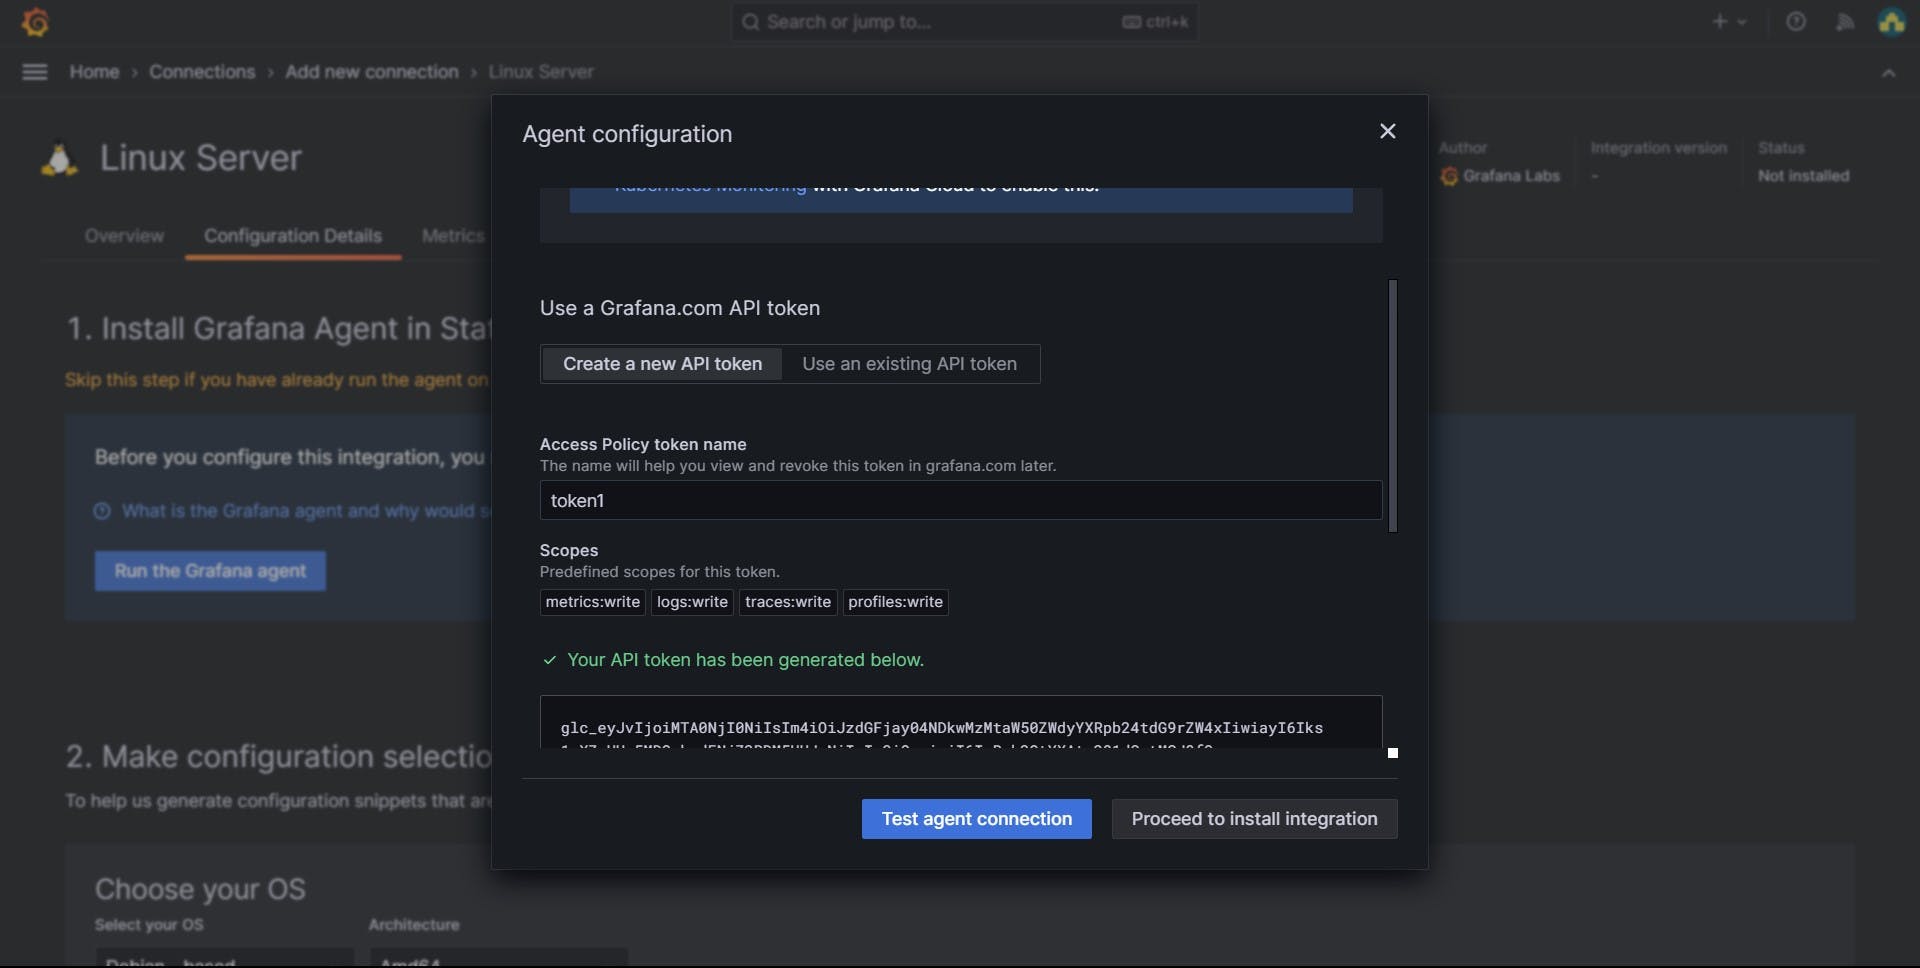
Verify Configuration: Test the agent configuration to ensure that data collection is operational and accurate.
Integrate Amazon EC2: Navigate to the Grafana Cloud dashboard and add Amazon EC2 to monitor various metrics such as CPU usage, memory utilization, and network connections.
Organize Dashboard: Customize the dashboard layout to visualize real-time metrics and status updates effectively.


Configuring Grafana Alerts for AWS Billing
Utilize AWS CloudWatch: Leverage AWS CloudWatch to integrate with Grafana Cloud for monitoring AWS billing metrics.
Set up Billing Alerts: Within the AWS Management Console, configure billing alerts by selecting relevant metrics such as Total Estimated Charge in USD.
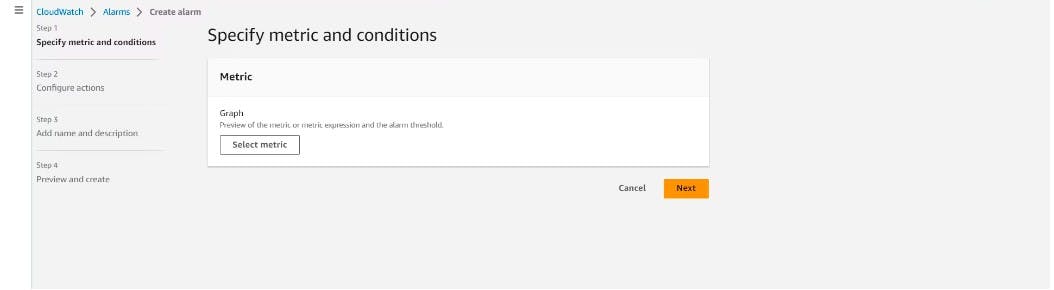
Define Thresholds: Set thresholds for billing alerts and specify actions to be taken when thresholds are exceeded.
Integrate with SNS: Configure AWS Simple Notification Service (SNS) to trigger email alerts when billing thresholds are breached.
Review and Finalize: Review the configured alert rules and finalize the setup to ensure seamless monitoring of AWS billing.


Additional Integration Steps:
Connect CloudWatch to Grafana Cloud: Establish a connection from AWS CloudWatch to Grafana Cloud to enable seamless data flow between the two platforms, facilitating efficient monitoring and analysis of AWS metrics within Grafana.
Integrate AWS Billing Metrics: Enhance your monitoring capabilities by integrating specific AWS billing metrics into Grafana Cloud. This integration provides granular visibility into billing data, allowing for proactive cost management and optimization.
Navigate the Grafana cloud dashboard and add the Billing/usage to view the billing alert that we set up above.
We can now view the Billing dashboard on Grafana cloud.
We can set up the Alert rules by navigating to Alerts & IRM on the console. Click on the alert rules.
Select the Cloudwatch option and then create an alert.
Modify the alert rule to create the AWS Billing alert.
Customize Grafana Dashboards: Tailor Grafana dashboards to suit your monitoring needs by customizing visualizations, adding widgets, and organizing metrics based on your preferences. This customization ensures a personalized monitoring experience tailored to your unique requirements.


Conclusion
In conclusion, mastering Grafana Cloud monitoring empowers DevOps teams to proactively manage their infrastructure and respond swiftly to emerging issues. By following the guidelines outlined in this article, you can harness the full potential of Grafana Cloud for monitoring EC2 instances and managing AWS billing alerts. Happy monitoring!